Overview
Cards for CPU, GPU, memory, drives, network, temperatures, fans and battery. Drag, resize or hide them.
NexaView shows your computer’s CPU, graphics card, memory, drives, temperatures and fans live on your iPad, phone or any browser at home.
Early version: there may be bugs.
Illustration with demo data, not real readings.
A small program, the NexaView agent, runs quietly on your PC. Your other devices connect to it over your own Wi-Fi, or from anywhere with Tailscale.
The agent reads the hardware, starts by itself with the computer and keeps 7 days of history.
Home Wi-Fi or Tailscale →Settings → Connection → Show QR code, then scan it. Devices without the code are refused.
Live data →iPad, Android phone or any browser shows the dashboard. The Android app adds the phone’s own readings too.
Seven pages, in English, Tiếng Việt and 中文. When a value can’t be read, NexaView says “Unavailable” instead of guessing.
Cards for CPU, GPU, memory, drives, network, temperatures, fans and battery. Drag, resize or hide them.
Charts from the last minute up to the last 7 days, with averages and peaks.
Which programs use the most CPU and memory. Ending one always asks first.
Motherboard, BIOS, memory, drives, displays, battery wear and charge cycles.
Alerts when something runs hot or full, with a notification and plain advice.
Your games, live gaming charts, benchmarks, power modes and music.
Settings → Customization.
Ask “how do I turn on fan RPM?” and it explains, changes the setting or opens the page. Works offline.
Checks every 6 hours. Sign in with email or Google; the account lives on your PC.
Without touching the game. NexaView never injects anything into a game, so it can’t upset anti-cheat.
Switch views, pick parts and run example checks. Every number is made up in your browser: this page never reads your computer.
Demo data. Everything here is simulated in your browser. Demos marked Concept are ideas, not part of NexaView.
Pick what the example PC is doing and watch the processor, graphics card and memory respond, the way NexaView’s Overview does.
Loading the demo…
Switch the reading, the time range and the chart style. NexaView’s My widgets offers the same three styles: Line, Area and Bars.
Pick a task, then run an example check. In NexaView the analyzer watches 30 seconds of your PC’s real readings; here it uses made-up readings and takes 3 seconds.
Turn the example PC around, open it up and pick a part to learn what it does, what it’s good at and where it struggles.
Move the readings of an example PC and see how NexaView’s new Health tab scores it: temperatures, free space and battery wear, compared with your alert limits.
Pick an upgrade for the example PC and see which tasks would gain, and what would hold it back next.
What each release added, improved and fixed, with real screenshots. Small patch versions sit inside their release.
What’s out, what’s being built, what’s planned and what’s only an idea. No percentages and no promises: a date appears only when a release day is set.
The pictures are real screenshots of NexaView 2.9.2, the version you can download today, running with demo data.
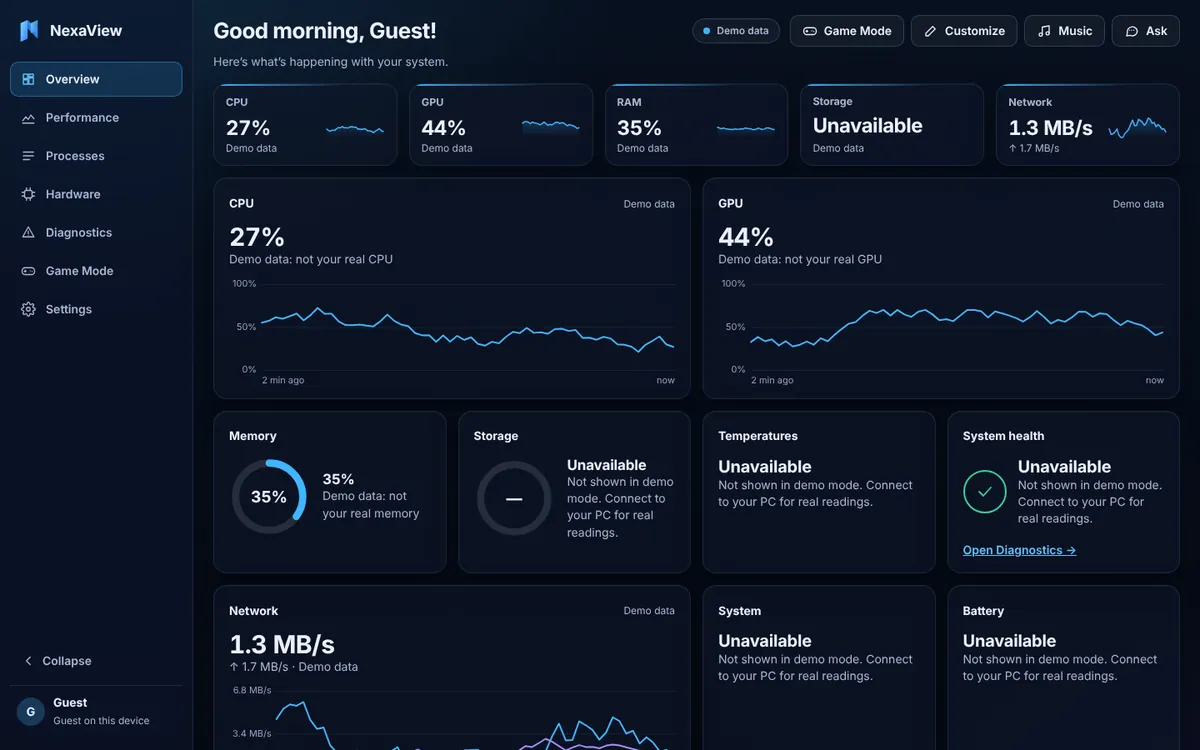
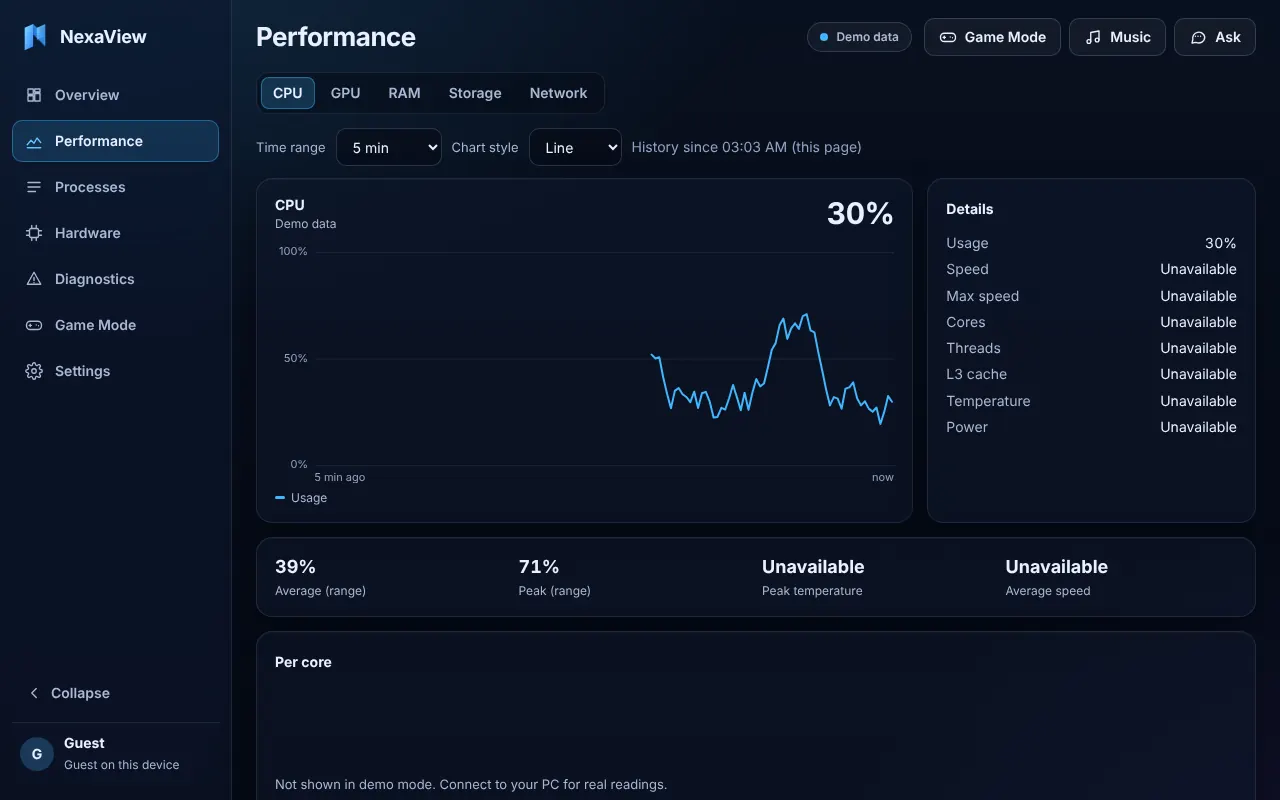
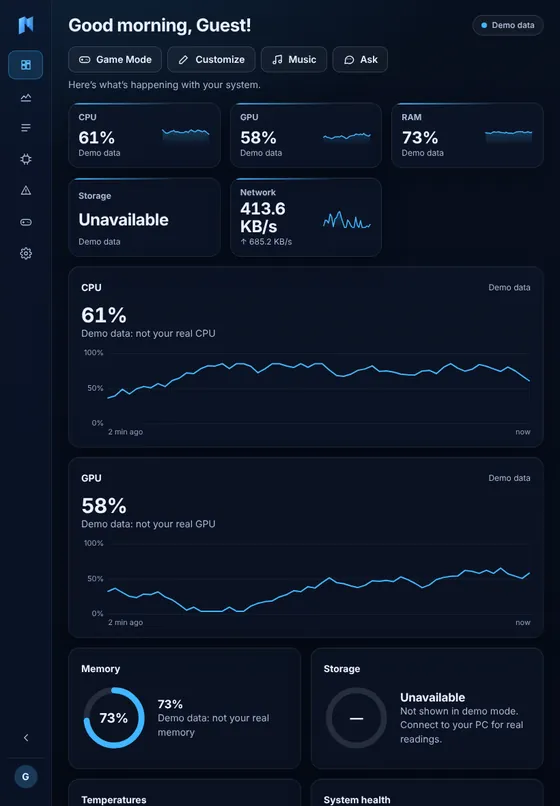
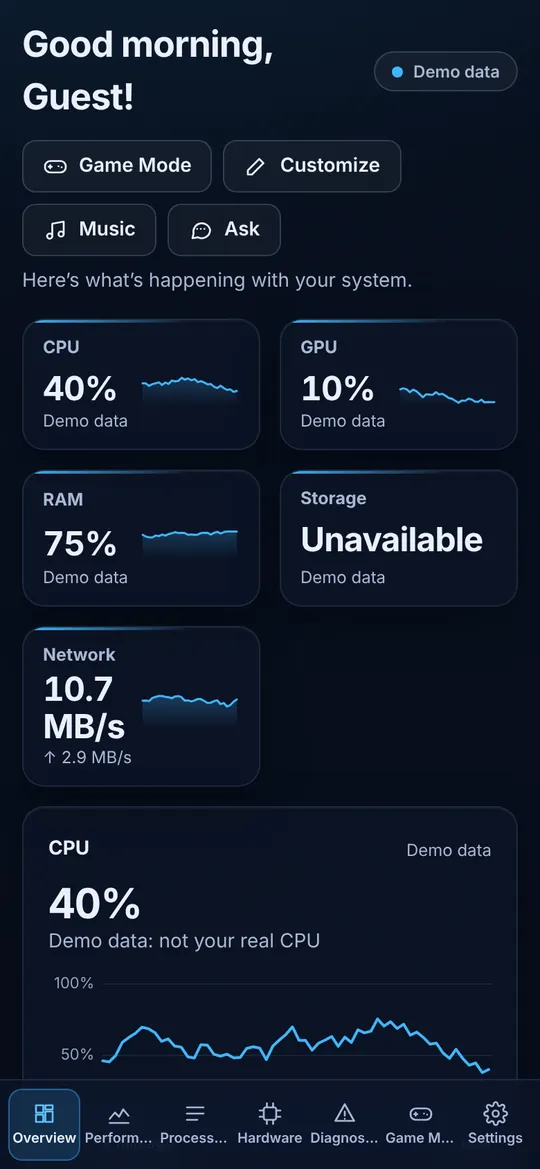
CPU speed, GPU use, memory and battery come from Windows itself. Fans and most temperatures need the free LibreHardwareMonitor.
Tested on an MSI laptop with CachyOS. Reads fans, temperatures and both graphics cards.
Temperatures and fan speeds show “Unavailable”: macOS keeps them for admin-only tools.
The phone’s battery, memory, storage, network and heat level. Android hides CPU use and most temperatures.
The dashboard in Safari, added to the Home Screen. It can’t show the iPad’s own readings yet: that is on the roadmap.
Chrome, Firefox, Edge or Safari on the same network as the PC, or from anywhere with Tailscale.
Only the PC reads hardware: Windows, Linux and Mac run the NexaView agent, and every other screen shows that PC’s dashboard. The tablet and phone pictures are the dashboard’s own layout for smaller screens in a browser. The Android app is the one app that also reads the device it runs on. “Checked on GitHub” means built and tested on GitHub’s machines, not on a real Mac.
A number NexaView can’t read shows “Unavailable”. Demo numbers say “Demo data”. The Bottleneck analyzer refuses to judge demo data at all.
The agent is a small program that runs quietly in the background. Game Mode never injects into games, and the dashboard only blurs its floating panels so it draws quickly.
Ending a program or changing the power mode always asks first. 2.11’s Privacy & data page lets you choose how long history is kept, and clear or export it.
One honest place to see, understand and act on what your PC is doing, on every screen you own. Next come sharing with friends, driver updates, a game overlay and a health score; further out are ideas like 3D Discover and an upgrade simulator. The roadmap shows where each one stands.
Install it on the PC you want to watch, then pair your phone or iPad. Tap a row for the steps.
Which version you get: the Windows and Android files are NexaView 2.9.2. The 2.11.0 release page is up, but its full builds aren’t on it yet, so its Windows and Android files are still the 2.9.2 ones.
Every file is on the public release page.
This watches your computer. An iPad and iPhone app (.ipa, installed with iloader or SideStore) is also on the 2.11.0 release page.